Chemistry · Updated 18 August 2026
Pool chemical levels chart
Every reading, what it does, and what happens at each end of the range — adjusted for your sanitiser and your pool surface, because one chart genuinely does not fit both.
Your target levels
Not one chart for every pool — surface and sanitiser both move the numbers.
| Reading | Acceptable | Ideal | Test every |
|---|---|---|---|
| Free chlorine | Depends on CYA | — | Twice a week |
| pH | 7.2–7.8 | 7.4–7.6 | Twice a week |
| Total alkalinity | 60–120 ppm | 80–100 ppm | Monthly |
| Calcium hardness | 250–450 ppm | 300–400 ppm | Monthly |
| Cyanuric acid | 30–50 ppm | 30–40 ppm | Monthly |
Notice the highlighted row. Every printable chart you have seen puts a number in it — usually 1–3 ppm. That number is right at CYA 30 and badly wrong at CYA 100, and printing it as a fixed value is the single most common error in pool literature. Work out yours from your CYA.
The only thing actually sanitising the water. Everything else on this chart exists to keep it working.
Too low: Algae gets a foothold, and it happens faster than people expect once you cross the minimum for your CYA.
Too high: Far less of a problem than folklore suggests — shock level is several times target and still swimmable. It is hard on swimwear and vinyl at extremes.
Swimmer comfort, and how efficiently your chlorine works. Drifts upward in most pools, especially salt.
Too low: Corrosive — attacks grout, metal fittings and heater components. Stings eyes.
Too high: Chlorine loses effectiveness, scale forms, and water goes cloudy. Also stings eyes, which is why 'burning eyes' is a pH symptom more often than a chlorine one.
The buffer that stops pH bouncing around. If your pH will not hold still, this is almost always why.
Too low: pH swings wildly on small additions — the classic 'I added a little acid and it crashed'.
Too high: pH climbs persistently and resists correction. Salt pools run a lower target because the cell pushes pH up anyway.
Stops the water dissolving calcium out of your pool's surfaces. The reading that varies most by where you live.
Too low: Water takes calcium from plaster, grout and stone — etching and pitting that does not reverse. New England's soft tap water makes this the regional trap.
Too high: Scale on surfaces, heater elements and salt cells. Southwest tap water often arrives above target before you add anything.
Sunscreen for chlorine. Protects it from UV — and binds it, so it sets what your chlorine target has to be.
Too low: Sunlight destroys free chlorine within hours. An unstabilised outdoor pool can lose most of it in an afternoon.
Too high: Chlorine is present but suppressed. Past ~80–100 ppm you are into chlorine lock, and the only way down is replacing water.
Why this chart is interactive
The printable version has to lie to fit on one page
Search for a pool chemical levels chart and you will get a JPEG. It will give one range per reading, it will be screenshotted onto a thousand Pinterest boards, and for a large share of the people reading it, at least two of those numbers will be wrong for their pool.
Calcium hardness is the clearest example. A plaster pool needs calcium in the water — around 300–400 ppm — because if the water is short of it, it takes what it needs from the plaster and grout, which etches and does not reverse. A vinyl liner has no calcium to give up, so the floor is far lower and a plaster-tuned chart pushes vinyl owners to add calcium they do not need. Same chart, opposite mistake, depending on what your pool is made of.
Cyanuric acid is the second. A chlorine pool wants 30–50 ppm. A saltwater pool deliberately runs 60–80, because the cell produces chlorine slowly and continuously and needs more UV protection to hold it. A single-number chart has to pick one and mislead the other half of its readers.
And total alkalinity moves too: salt pools target a lower band, because the cell drives pH upward on its own and a high alkalinity makes that harder to control rather than easier.
The row with no number in it
Free chlorine is not a fixed target and never was
This is the important one, and it is why we would rather you use this page than print anything. Almost every chart in circulation puts 1–3 ppm in the free chlorine row. That figure is reasonable at CYA 30 and close to meaningless at CYA 100 — same water, same reading, completely different sanitising power.
Cyanuric acid binds most of the chlorine in your pool and holds it in reserve, protected from sunlight. Bound chlorine is not working chlorine, so as CYA rises you need proportionally more total chlorine to keep the same amount active. At CYA 30 you need about 3.5 ppm. At CYA 100 you need around 11 ppm.
A pool owner holding a printed chart at 3 ppm with a CYA of 95 is running an under-sanitised pool that tests perfectly. That is not an edge case — it is the single most common way a well-maintained pool turns green, and it is caused by the chart rather than by neglect.
Go deeper
The readings, one at a time
How much chlorine to add
Your target from your CYA, then the dose for whichever form you use.
Liquid vs tablets vs granular
Same sanitiser, different passengers. Cost per ppm, and what each leaves behind.
How many tablets does my pool need?
From real demand rather than a rule of thumb — and the CYA it adds every week.
Free chlorine vs total chlorine
What the gap between the two readings means — including the one that looks healthy and isn't.
Pool shock calculator
Algae and chloramines need different levels. This returns whichever is higher, and says which.
How to clear a green pool
The level to hold, the days it takes, and what the whole job costs in chlorine.
Why is my pool cloudy?
Chemistry or filtration — and how long it can possibly take, from your pump and filter.
Raising pH and alkalinity
Baking soda, soda ash or neither — the dose, the order, and where your pH is drifting.
Pool opening checklist
The startup sequence in order, with an amount for every step — and whether you need shock at all.
Lowering cyanuric acid
How much water to replace, how to do it safely, and when not to bother.
Reading the chart in the right order
Fix these in sequence, not all at once
When several readings are out at the same time, the order you correct them in decides whether you get there in one afternoon or chase your tail for a fortnight. The readings are not independent — three of them push each other around.
1. Total alkalinity first. It is the buffer holding pH steady, so correcting pH while alkalinity is out means it will simply drift back. Get the buffer right and pH usually settles on its own.
2. pH second, once it has something to hold it. Aim for the middle of the range rather than the edge, because it is easier to let it drift into range than to chase it back from outside.
3. Cyanuric acid third, because it decides your chlorine target and because it is the slowest and most expensive thing to change. There is no point setting a chlorine level before you know what level you are aiming at.
4. Free chlorine last, calculated from the CYA you just confirmed. Calcium hardness sits outside this sequence — it moves slowly and can be corrected whenever, though it is worth knowing before you choose a shock product, since cal-hypo adds calcium every time you use it — and a shock dose adds a season’s worth in one afternoon.
What a chart can’t tell you
Three things that change the right answer
Where you live. Season length runs from about twelve weeks to year-round across the US, and peak chlorine demand varies by more than double between the Pacific Northwest and the desert Southwest. Tap water splits the country the same way — New England’s granite gives water soft enough that calcium has to be added, while much of the Southwest arrives above the calcium target before you put anything in. A national chart cannot know which of those you are.
What you chlorinate with. If you use trichlor tablets, your cyanuric acid is climbing every week whether you test it or not, which means the chlorine row of this chart is moving under you all season. Liquid chlorine and cal-hypo add none. The chart shows a target; only your dosing habit decides whether it stays achievable.
How old your reagents are. Every number here assumes your test is telling the truth. Drop reagents drift about a year after opening — buyers report the DPD bottle failing first — and test strips degrade fast in heat, with one owner measuring alkalinity nearly 100 points high after storing them beside a hot tub through summer. A chart cannot correct for a bad reading, and a confidently wrong number is worse than no number.
Printing it
By all means print this — with one warning
People want a chart on the pump-house wall, and that is a completely reasonable thing to want. Print this page if it helps. But write your own CYA reading and your own chlorine target on it in pen, because those are the two values that are specific to your pool and they are the two that a printed chart cannot carry.
Then date it. Cyanuric acid only moves one direction while you are using tablets, so a target written in June is a different target by August — and a chart taped to a wall is trusted long after the number on it stopped being true. Re-check monthly, cross out the old figure, write the new one.
Where this leaves you
A chart is only as good as the readings you put into it
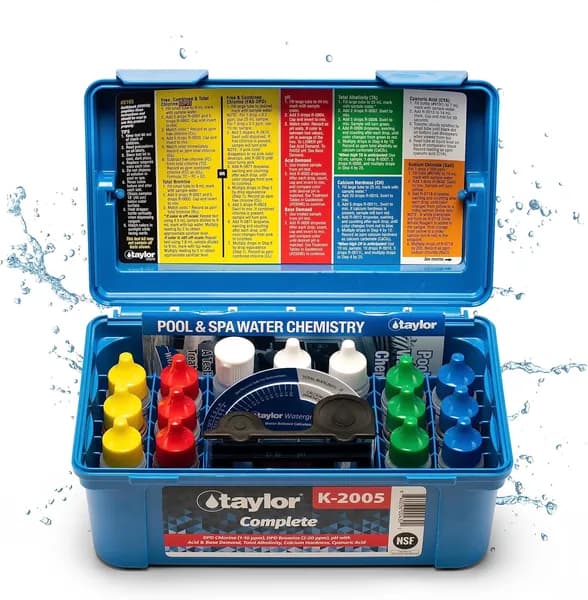
- Reads all five: chlorine, pH, alkalinity, calcium hardness and cyanuric acid
- Separates free from total chlorine, which strips and basic kits cannot
- CYA by drop test — the reading this whole chart depends on
- Reagents sold individually, so one expired bottle is never a new kit
We don't field-test products. This is the cheapest kit we track that reads every row of the chart above — see our editorial policy for how picks get made.